
In this blog post we will see how we can leverage Amazon CloudWatch Logs for centralized logging in Amazon AWS environment. A demo application is provided to see things in action. The plan is the following:
- deploy the application on an EC2 instance
- configure logging to send the log events to CloudWatch Logs service
- launch multiple ec2 instances running the demo application
- browse logs from multiple EC2 instances
Running the demo application locally
$ git clone https://github.com/altfatterz/cloudwatch-logs-demo
$ cd cloudwatch-logs-demo
$ mvn clean package
Note that currently startup could take more than 20 seconds, because of this.
$ java -jar target/cloudwatch-logs-demo-0.0.1.jar --spring.profiles.active=local
Then requesting metadata information about where the application is running:
$ curl http://localhost:8080 | jq
{
  "instanceId": "N/A",
  "instanceType": "N/A",
  "publicIp": "N/A",
  "privateIp": "N/A",
  "availabilityZone": "N/A"
}
Obviously cannot provide the metadata information since it is not running in an EC2 environment. In the logs you can see:
2017-01-13 14:19:09.722 INFO 18008 --- [nio-8080-exec-5] com.example.ApplicationInfoController : handling info request on instance with ip N/A
Preparing EC2 environment
First we need to create an IAM custom role including couple of managed policies and one inline policy.
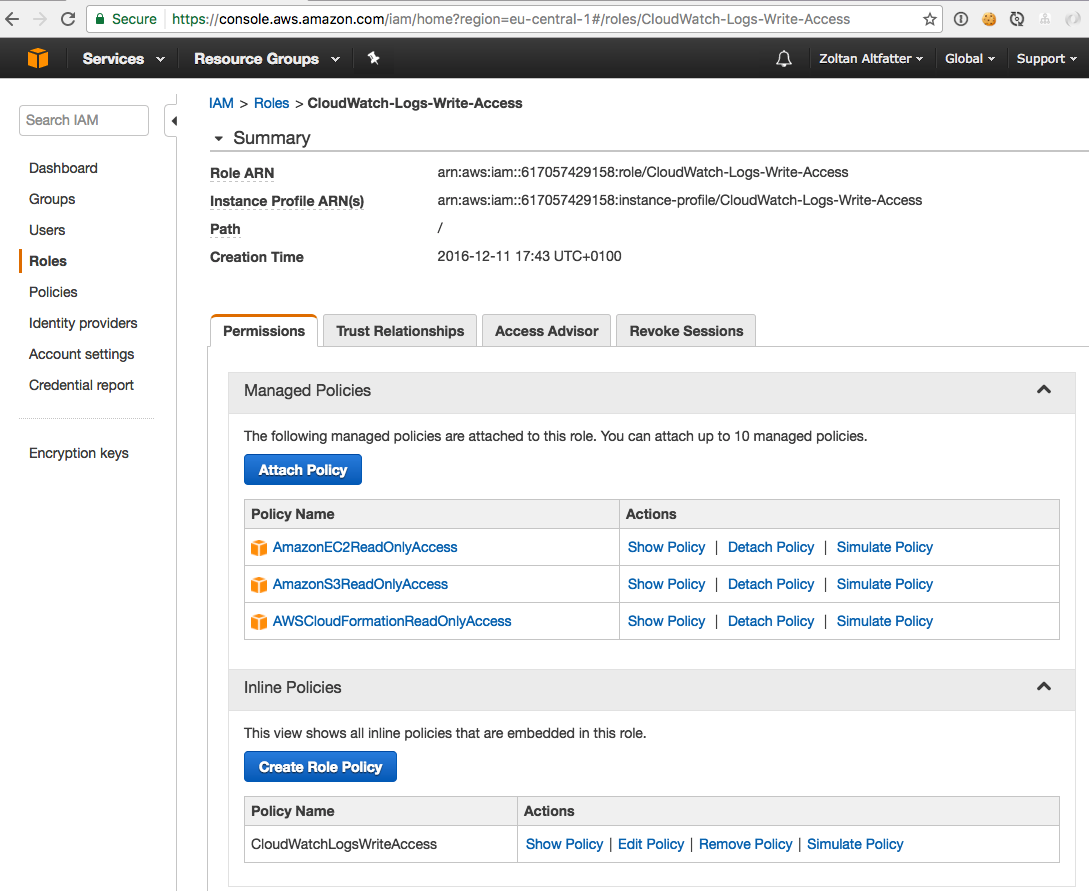
The inline policy CloudWatchLogsWriteAccess enables the EC2 instance to push log events into Cloudwatch Logs service.
{
  "Version": "2012-10-17",
  "Statement": [
    {
      "Effect": "Allow",
      "Action": [
        "logs:CreateLogGroup",
        "logs:CreateLogStream",
        "logs:PutLogEvents",
        "logs:DescribeLogStreams"
      ],
      "Resource": [
        "arn:aws:logs:*:*:*"
      ]
    }
  ]
}
Next we need to create a security group with inbound rules for ports 22, 8080 and 80.
$ aws ec2 create-security-group --group-name CloudWatchLogsDemoSecurityGroup --description "CloudWatch Logs Demo Security Group"
{
    "GroupId": "sg-ee878e86"
}
$ aws ec2 authorize-security-group-ingress --group-id sg-ee878e86 --protocol tcp --port 22 --cidr 0.0.0.0/0
$ aws ec2 authorize-security-group-ingress --group-id sg-ee878e86 --protocol tcp --port 8080 --cidr 0.0.0.0/0
$ aws ec2 authorize-security-group-ingress --group-id sg-ee878e86 --protocol tcp --port 80 --cidr 0.0.0.0/0
Upload artifacts to S3
We upload all our artifacts needed to run the service to S3 and during launching the EC2 instances we download from S3.
$ aws s3 cp target/cloudwatch-logs-demo-0.0.1.jar s3://spring-boot-examples/cloudwatch-logs-demo/
$ aws s3 cp cloudwatch-logs-demo.conf s3://spring-boot-examples/cloudwatch-logs-demo/
$ aws s3 cp awslogs/awscli.conf s3://spring-boot-examples/cloudwatch-logs-demo/
$ aws s3 cp awslogs/awslogs.conf s3://spring-boot-examples/cloudwatch-logs-demo/
The cloudwatch-logs-demo.conf is needed to set the spring profile to run the application as a service on the EC2 instance.
The awscli.conf is needed to set the region for the AWS CLI utility. Note that the access and secret keys are not set since we use IAM role for identification which is the better approach.
The awslogs.conf is the configuration file which is used by the CloudWatch Logs Agent running next to our application on the EC2 instance. It specifies which from log files should send the log entries to the CloudWatch Logs service.
[general]
# Path to the CloudWatch Logs agent's state file. The agent uses this file to maintain client side state across its executions.
state_file = /var/lib/awslogs/agent-state
# enables gzip http content encoding to send compressed payloads to CloudWatch Logs
use_gzip_http_content_encoding = true

[/var/log/cloudwatch-logs-demo]
file = /var/log/cloudwatch-logs-demo.log
buffer_duration = 5000
log_stream_name = {instance_id}
initial_position = start_of_file
log_group_name = /var/log/cloudwatch-logs-demo
Create EC2 instances
With the following command we start two instances leveraging the previously created IAM role, security group.
$ aws ec2 run-instances --image-id ami-211ada4e --count 2 --instance-type t2.micro --key-name frankfurt_key_pair --iam-instance-profile Name=CloudWatch-Logs-Write-Access --security-groups CloudWatchLogsDemoSecurityGroup --user-data file://bootstrap.sh
With the --user-data we specify a script which configures the EC2 instances during launch. The script is the following:
#!/bin/bash

# update
yum update -y

# install awslogs
yum install awslogs -y

# install java 8
yum install java-1.8.0 -y

# uninstall java 7
yum remove java-1.7.0-openjdk -y

# create the working directory
mkdir /opt/cloudwatch-logs-demo

# download the maven artifact from S3
aws s3 cp s3://spring-boot-examples/cloudwatch-logs-demo/cloudwatch-logs-demo-0.0.1.jar /opt/cloudwatch-logs-demo/cloudwatch-logs-demo.jar --region=eu-central-1
aws s3 cp s3://spring-boot-examples/cloudwatch-logs-demo/cloudwatch-logs-demo.conf /opt/cloudwatch-logs-demo/ --region=eu-central-1
aws s3 cp s3://spring-boot-examples/cloudwatch-logs-demo/awscli.conf /etc/awslogs/awscli.conf --region=eu-central-1
aws s3 cp s3://spring-boot-examples/cloudwatch-logs-demo/awslogs.conf /etc/awslogs/awslogs.conf --region=eu-central-1

# create a springboot user to run the app as a service
useradd springboot

# springboot login shell disabled
chsh -s /sbin/nologin springboot

chown springboot:springboot /opt/cloudwatch-logs-demo/cloudwatch-logs-demo.jar
chmod 500 /opt/cloudwatch-logs-demo/cloudwatch-logs-demo.jar

# create a symbolic link
ln -s /opt/cloudwatch-logs-demo/cloudwatch-logs-demo.jar /etc/init.d/cloudwatch-logs-demo

# start the cloudwatch-logs-demo and awslogs services
service cloudwatch-logs-demo start
service awslogs start

# automatically start cloudwatch-logs-demo and awslogs services if this ec2 instance reboots
chkconfig cloudwatch-logs-demo on
chkconfig awslogs on
After the instances are up let’s connect to one of them and verify that our application and the awslogs service are running
$ ssh [email protected] -i frankfurt_key_pair.pem
$ sudo su
$ service awslogs status
awslogs (pid  8150) is running...
$ service cloudwatch-logs-demo status
Running [8129]
and indeed
$ curl 54.93.175.253:8080 | jq
returns
{
  "instanceId": "i-018342304e834662a",
  "instanceType": "t2.micro",
  "publicIp": "54.93.175.253",
  "privateIp": "172.31.13.77",
  "availabilityZone": "eu-central-1b"
}
The log file parsed by CloudWatch Logs agent is located at /var/log/cloudwatch-logs-demo.log
In the logs of awslogs service (found at /var/log/awslogs.log) we can see that the service after creating CloudWatch Logs resources like log group, log stream sends log events to CloudWatch Logs service.
2017-01-13 15:17:43,427 - cwlogs.push.batch - INFO - 8150 - Thread-2 - Creating log group /var/log/cloudwatch-logs-demo.
2017-01-13 15:17:43,459 - cwlogs.push.batch - INFO - 8150 - Thread-2 - Creating log stream i-018342304e834662a.
2017-01-13 15:17:43,553 - cwlogs.push.publisher - INFO - 8150 - Thread-2 - Log group: /var/log/cloudwatch-logs-demo, log stream: i-018342304e834662a, queue size: 0, Publish batch: {'skipped_events_count': 0, 'first_event': {'timestamp': 1484320657226, 'start_position': 0L, 'end_position': 208L}, 'fallback_events_count': 0, 'last_event': {'timestamp': 1484320661239, 'start_position': 6103L, 'end_position': 6246L}, 'source_id': 'c615cf8bf27f6d5a2a2774d409d69669', 'num_of_events': 26, 'batch_size_in_bytes': 6896}
...
The log events are sent in batches based on buffer_duration, batch_count and batch_size configuration whichever occurs first. Defaults are 5000ms, 1000 log events and 32768 bytes.
Create an ELB
Let’s create an elastic load balancer on top of our EC2 instances.
$ aws elb create-load-balancer --load-balancer-name CloudWatchLogsLoadBalancer --listeners "Protocol=HTTP,LoadBalancerPort=80,InstanceProtocol=HTTP,InstancePort=8080" --security-groups sg-ee878e86 --availability-zones eu-central-1a eu-central-1b
{
    "DNSName": "CloudWatchLogsLoadBalancer-1547734729.eu-central-1.elb.amazonaws.com"
}
$ aws elb configure-health-check --load-balancer-name CloudWatchLogsLoadBalancer --health-check Target=HTTP:8080/health,Interval=10,UnhealthyThreshold=2,HealthyThreshold=2,Timeout=5
$ aws elb register-instances-with-load-balancer --load-balancer-name CloudWatchLogsLoadBalancer --instances i-018342304e834662a i-095790d2fddb29e54
Here we leverage the /health endpoint provided by Spring Boot. After around 20 seconds (HealthyThreshold * Interval) our load balancer is forwarding our requests to the two EC2 instances in round robin fashion:
$ curl http://cloudwatchlogsloadbalancer-1547734729.eu-central-1.elb.amazonaws.com | jq

{
  "instanceId": "i-018342304e834662a",
  "instanceType": "t2.micro",
  "publicIp": "54.93.175.253",
  "privateIp": "172.31.13.77",
  "availabilityZone": "eu-central-1b"
}

$ curl http://cloudwatchlogsloadbalancer-1547734729.eu-central-1.elb.amazonaws.com | jq

{
  "instanceId": "i-095790d2fddb29e54",
  "instanceType": "t2.micro",
  "publicIp": "52.59.247.39",
  "privateIp": "172.31.8.144",
  "availabilityZone": "eu-central-1b"
}
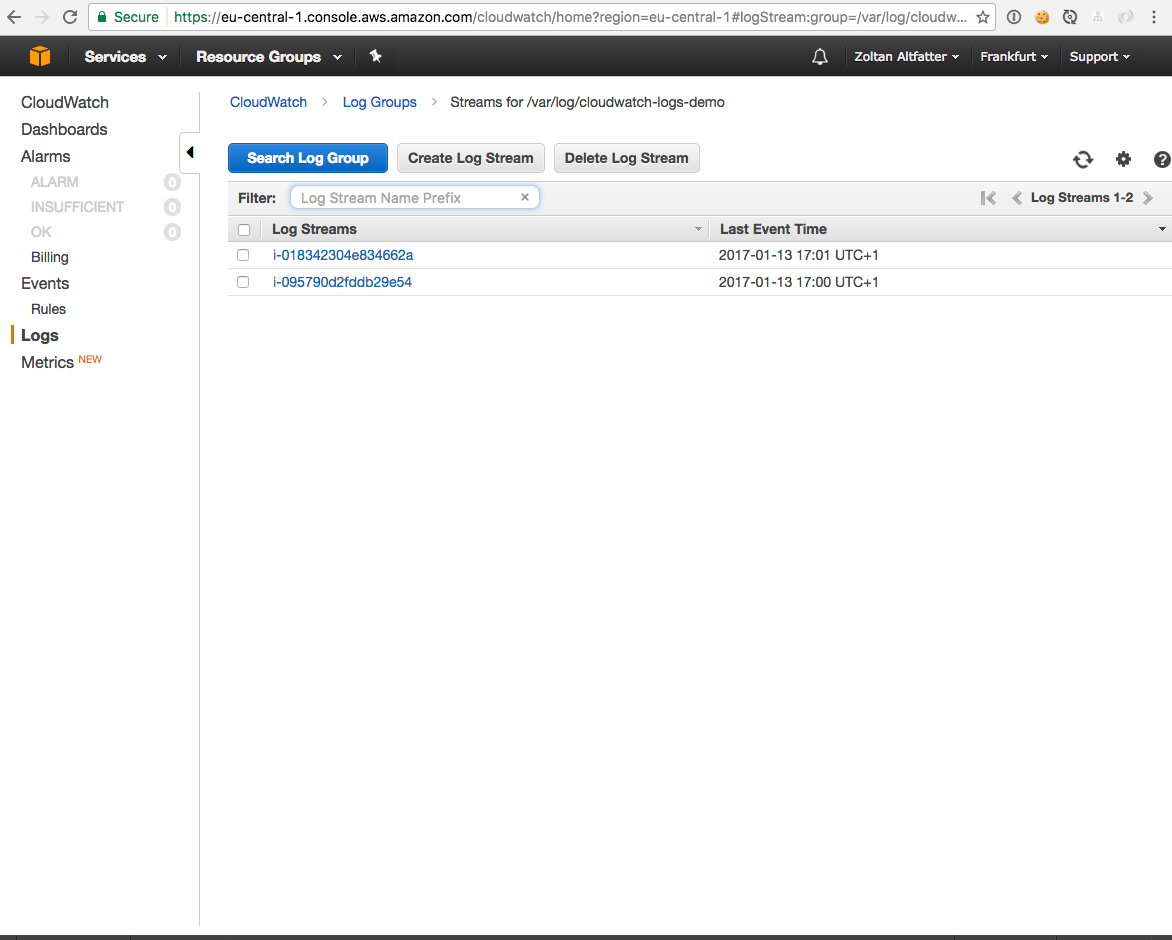
In the CloudWatch Logs console you can see the log group and the two log streams
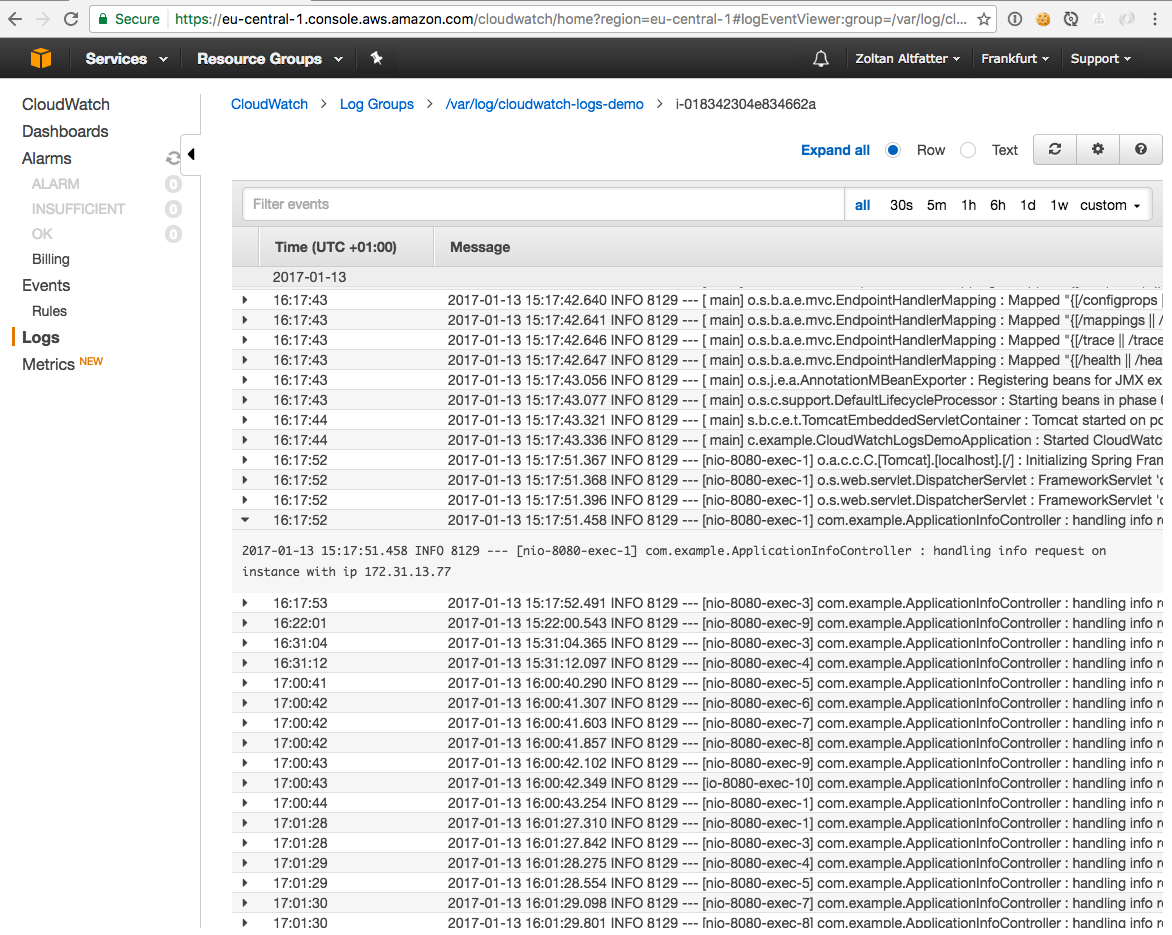
One log event inside a log stream:
As you can see we needed quite a lot of configuration to set everything up. In a next post we will see how we can make this simpler with Boxfuse